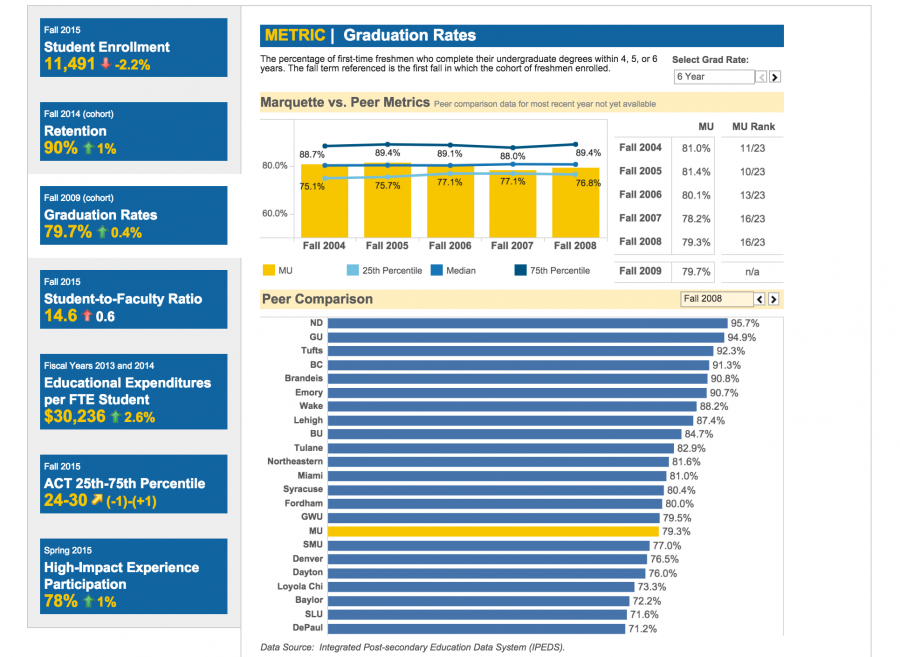
The Marquette community will soon be able to visually track the progress of the university’s strategic plan themes through online dashboards.
The Strategic Plan Coordinating Team, along with the Office of Institutional Research and Analysis and the Office of Marketing and Communication, created the online dashboards to assess the university’s progress toward achieving the strategic plan themes’ goals.
“The purpose of the dashboard is to assist us in assessing our progress toward the achievement of each theme’s goal,” said Marya Leatherwood, vice provost for strategic and academic planning, in an email. “As we make progress on the objectives and tactics outlined in the plan, we expect to see improvements in the metrics associated with the theme.”
The dashboards will be available on the strategic planning website once the board of trustees approves the project.
The six themes of the strategic plan are academic excellence, research in action, a culture of inclusion, formation of the mind and the heart, social responsibility through community engagement and sustainability of valuable resources.
Leatherwood said each theme’s dashboard visually represents the key metrics connected to the theme. Each metric included in a theme’s dashboard show’s Marquette’s current measurement, the previous year’s measurement and the direction of change.
For example, graduation rates are the metric for the academic excellence strategic theme. Goal stewards chose the metrics for each strategic plan theme with assistance from the Strategic Plan Coordinating Team.
“This allows us to see at a glance where we’ve made recent improvements or where improvement is still needed,” Leatherwood said.
The metrics for each dashboard will also include more detailed analyses such as trends over time and a comparison to a group of 22 universities. Alexandra Riley, director of the Office of Institutional Research and Analysis, said the President’s Advisory Team chose 22 private institutions to serve as the comparative group to Marquette.
“The group is aspirational by design, with 17 of the 22 schools ranking higher than Marquette in the U.S. News and World Report National Universities ranking,” Riley said in an email. “By comparing ourselves to a group of referent institutions, we can identify areas of distinctiveness and benchmark our performance over time.”
Riley and the Office of Institutional Research and Analysis were responsible for putting the dashboards into action after the metrics and comparison schools were selected. The Office of Institutional Research and Analysis worked with Leatherwood on the layout and OMC on the look and feel of the dashboards.
Riley said the dashboards were built with a statistic software package called SAS and a data visualization tool called Tableau.
“One of the biggest tasks with this project was simply gathering the vast collection of data from both Marquette and from our comparison schools,” Riley said. “We mined our own data and several public databases to get the information we needed. Our software tools allowed us to deliver a dashboard that is public, dynamic and interactive, with the added benefit of being relatively easy to maintain over time.”
Riley said building the dashboards began in early December and finished mid-January. Once the dashboards are on the strategic plan website, the Office of Institutional Research & Analysis will update the dashboards annually and add additional metrics as the strategic plan matures.
“Having the opportunity to look at Marquette across a wide range of metrics has been fascinating and I hope the Marquette community will find the dashboards to be a useful and informative tool,” Riley said.


